Introduction
Continuous profiling for automated performance tests with Perfana was the topic of my previous blog. Part 2 illustrates how you can use the flame graphs via our Pyroscope integration to find and fix CPU hotspots.
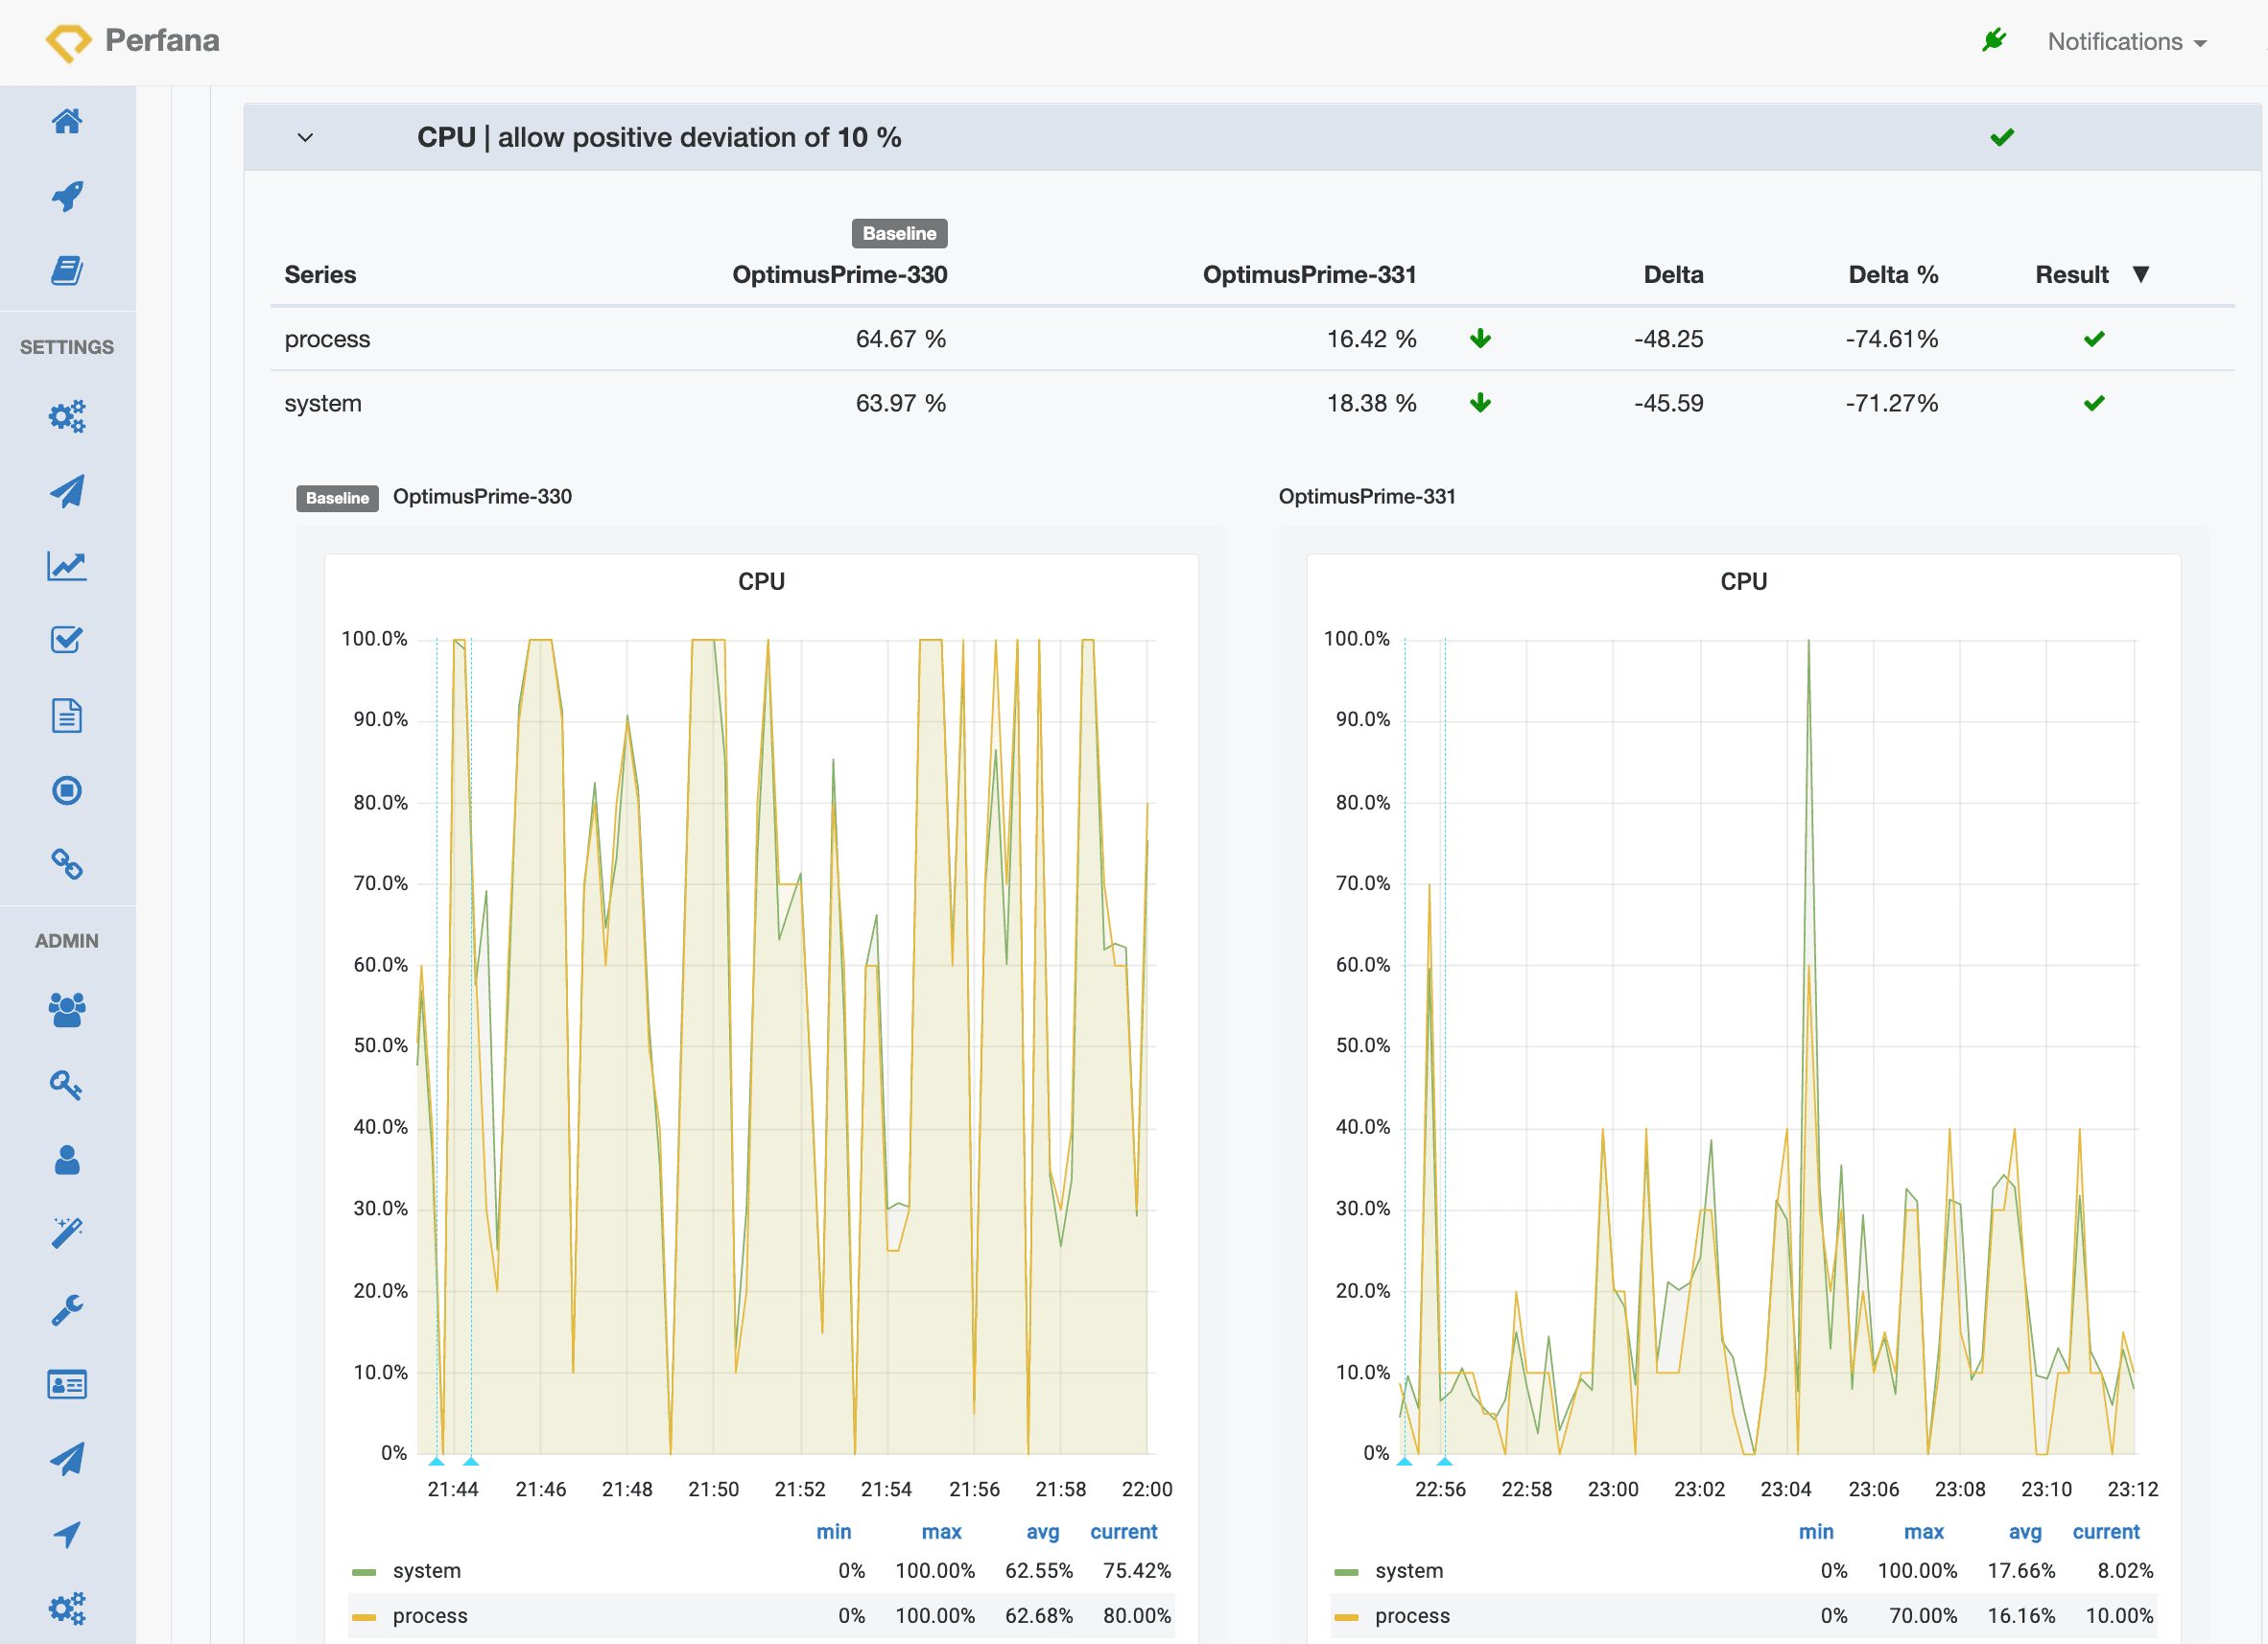
Perfana really shines when running performance tests for each build of your software. You can compare any metric available from build to build.
The screenshot below shows the automatic compare of response times to a previous baseline run. The arrows up show there is an increase in response times. Moreover, the increase exceeds the requirement, as indicated by the red exclamation marks.

The response times measured in the 99 percentile have increased more than 20%! Time to investigate this further. Perfana integrated tools like Jaeger and Pyroscope can help pinpoint the issue. From the tab bar you can conveniently deep dive in the exact data of the test run:

CPU hotspot investigation
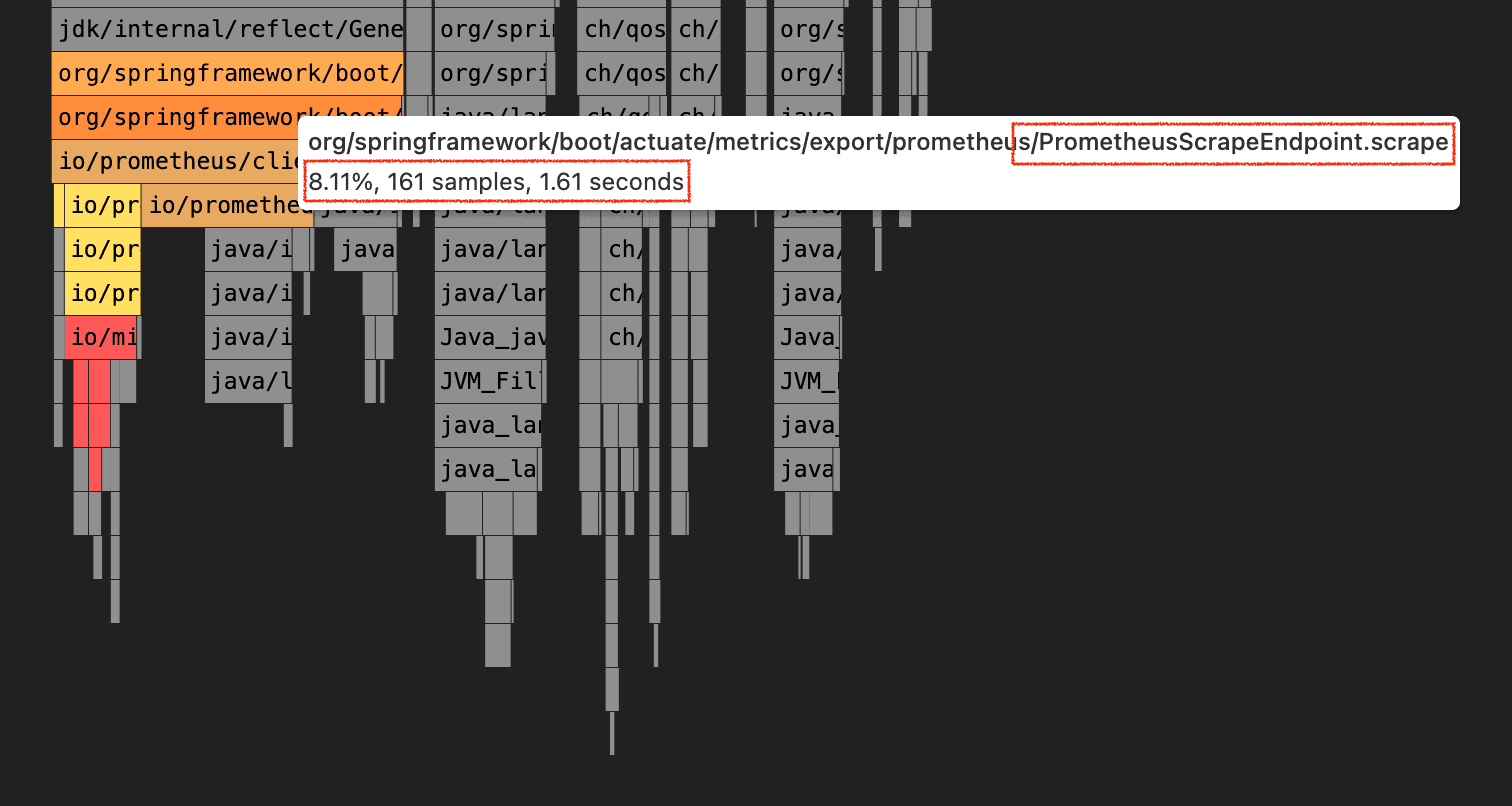
What follows is a story of investigating an increase of CPU usage detected by Perfana. As we focussed on one possible issue, we eventually found a deeper cause to the CPU overhead. It started by checking the CPU flame graphs. We spotted some CPU overhead in Spring Boot – Prometheus related code. Remember in these flame graphs the lowest bars are Java methods that are actually using CPU time.
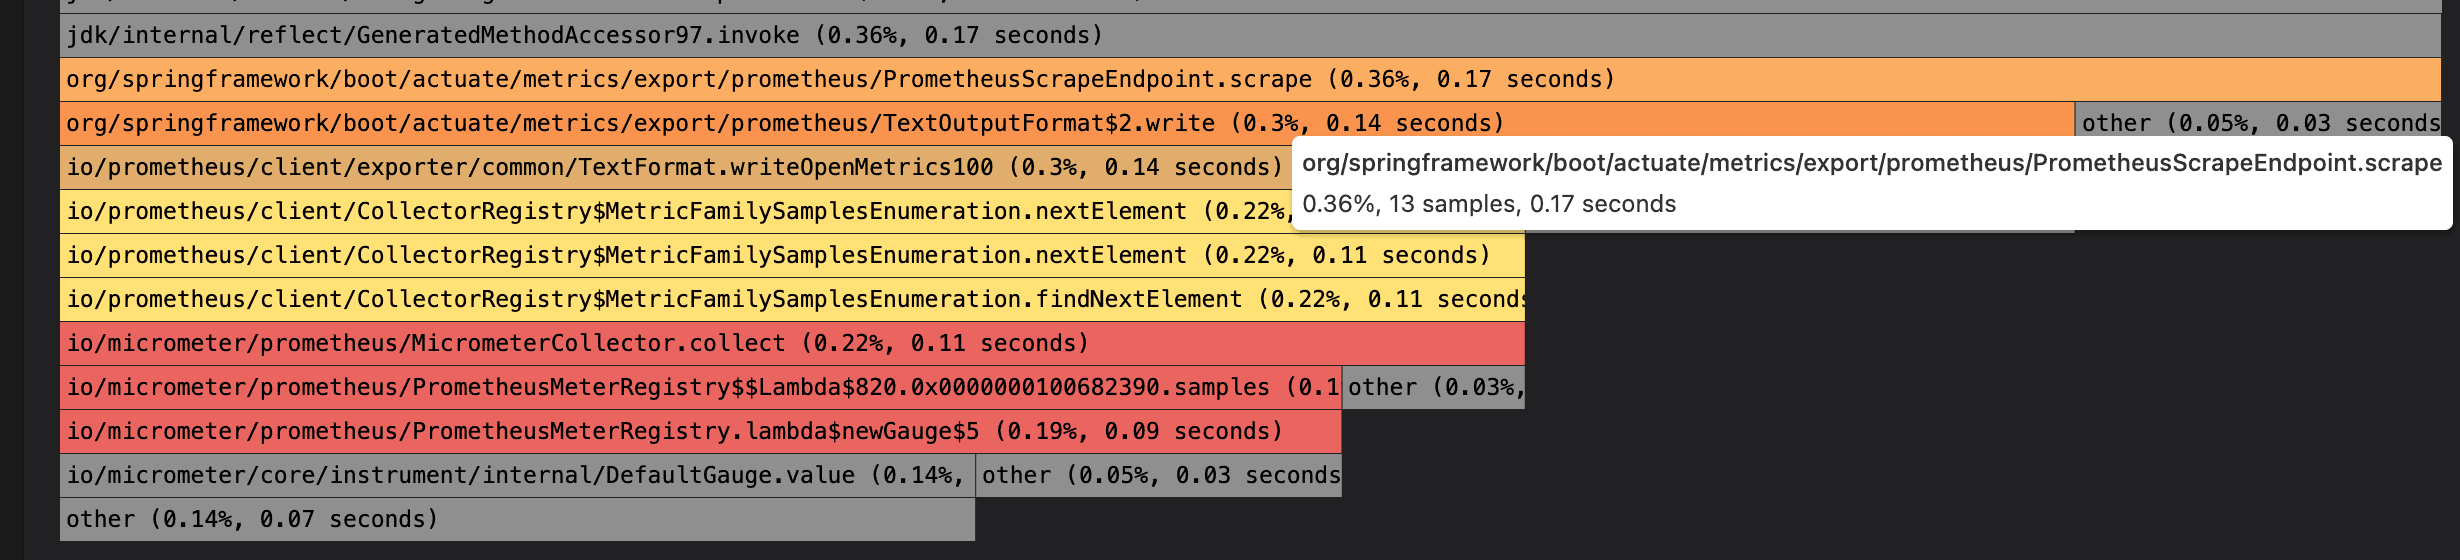
 The mouse-over shows the full name of the method. In the next screenshot you see the
 PrometheusScrapeEndpoint.scape() method that is in 8.11% of the flame graph samples. That is about 1.61 seconds of CPU time in this test run (sample frequency of 10 milliseconds for 161 samples).
You can zoom in and see more details by double clicking on the method bar:
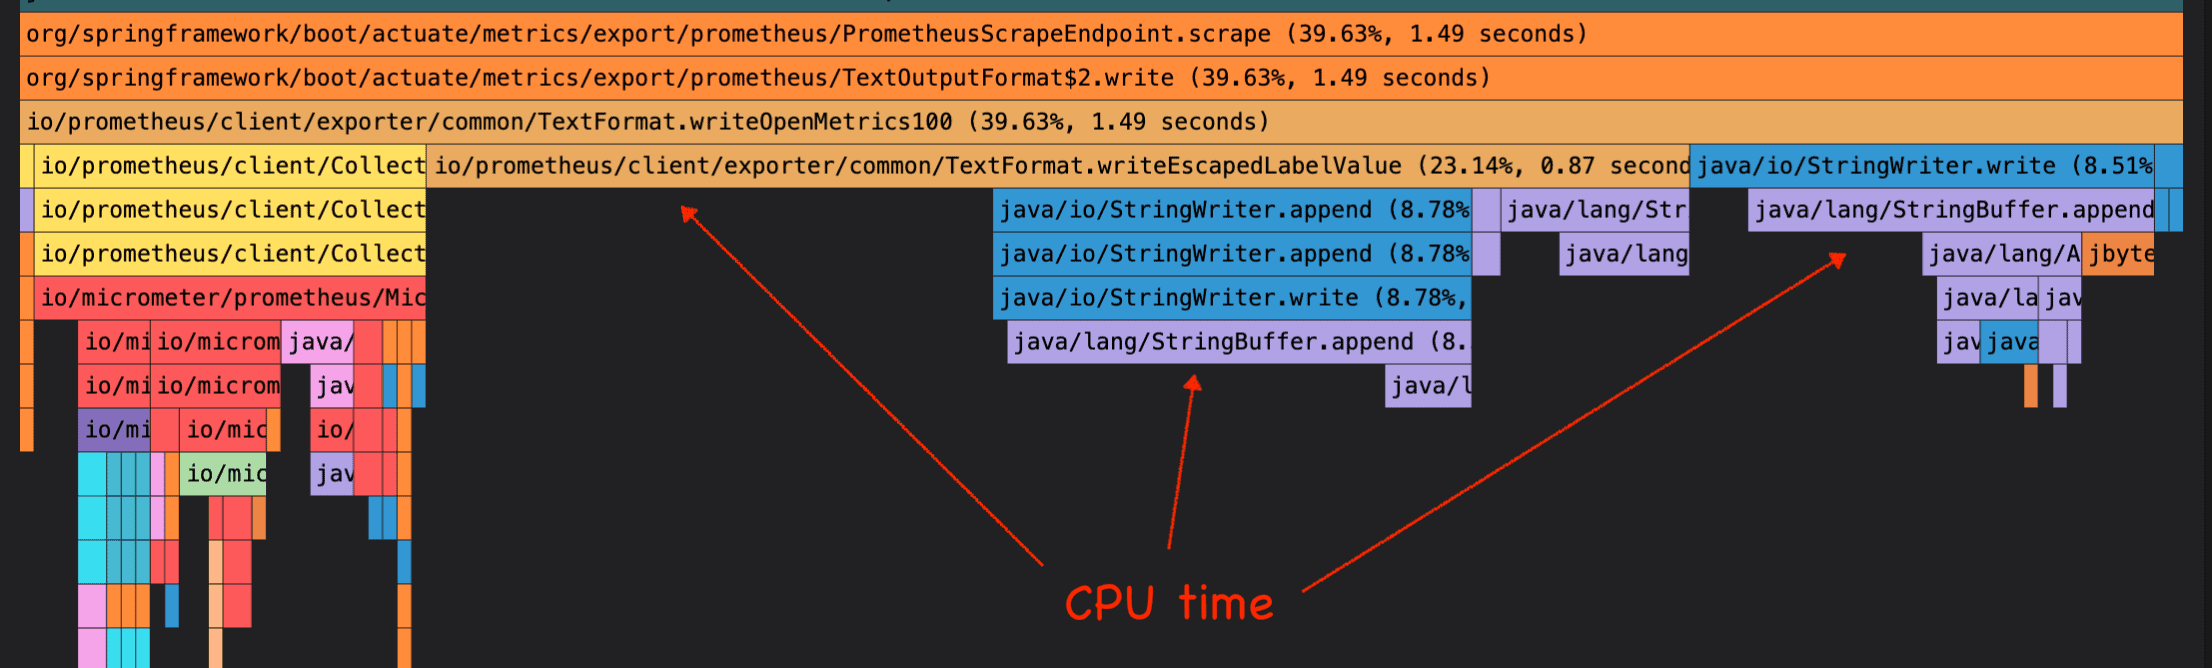
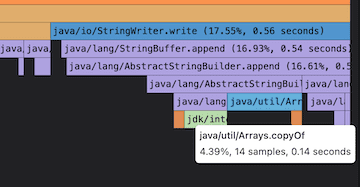
The lowest bars indicate time spent on CPU, so for instance in the StringWriter.append() and StringBuffer.append() methods. In another run we can even see further down the call stack and find the CPU busy in Arrays.copyOf().
Fix CPU hotspot
What is happening in the code and can we optimise for better performance? The Actuator Prometheus page is being scraped to get insight into the performance of the application. But scraping itself should not cause unnecessary resource usage!
Disclosure: to make the issue more visible for this blog we increased the sampling frequency of the Pyroscope agent to once every 13 ms and the Prometheus scraping frequency to once every 111 ms. We also decreased the container CPU resources from 2 to 1.
First a little background on the Prometheus scrape page. It is activated in Spring Boot via this setting:
management.endpoint.prometheus.enabled=true
The page is available at the following endpoint and can be scraped (pulled, not pushed) by Prometheus:
http[s]://afterburner:8080/actuator/prometheus
The data on the page looks like the following lines:
# TYPE hikaricp_connections_min gauge

hikaricp_connections_min{pool="basket-db-pool",service="optimus-prime-fe",system_under_test="OptimusPrime",test_environment="acc",} 3.0
This example shows a gauge with the JDBC connection pool usage. The line with # is a comment.
Remember the flame graphs above? Let’s see what the bars look like in actual code from Spring Boot:

This is the scrape() method that calls the format.write() method with a StringWriter as parameter. So why do the StringWriter / StringBuffer appends take a (relatively) long time as seen in the flame graphs? There is a hint in the collection of the PMD-JPinpoint performance rules:
“This creates an initial buffer of […] 16 characters [for StringWriter]. If this is not enough, a new byte/char array will be allocated and contents will be copied into the new array. The old array becomes garbage to be collected and copying takes processing time. If you know what the minimum or typical size will be, this garbage and processing time are wasted.”
When we look at the table of high CPU use in Pyroscope, we see entries related to StringBuffer.append(...) and Arrays.copyOf(...). Advice we get from the PMD-jPinpoint-rule is to pre-size the StringWriter with more bytes to avoid backing-array growth overhead while appending.
In the Java StringWriter source code we find the default constructor that creates an unsized new StringBuffer().
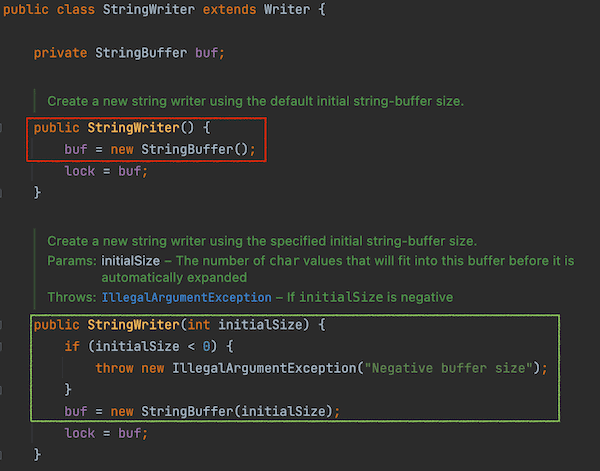 There is a second
 StringWriter(int initialSize) constructor. It is no surprise that this method creates a new StringBuffer(initialSize) with the given initial size!
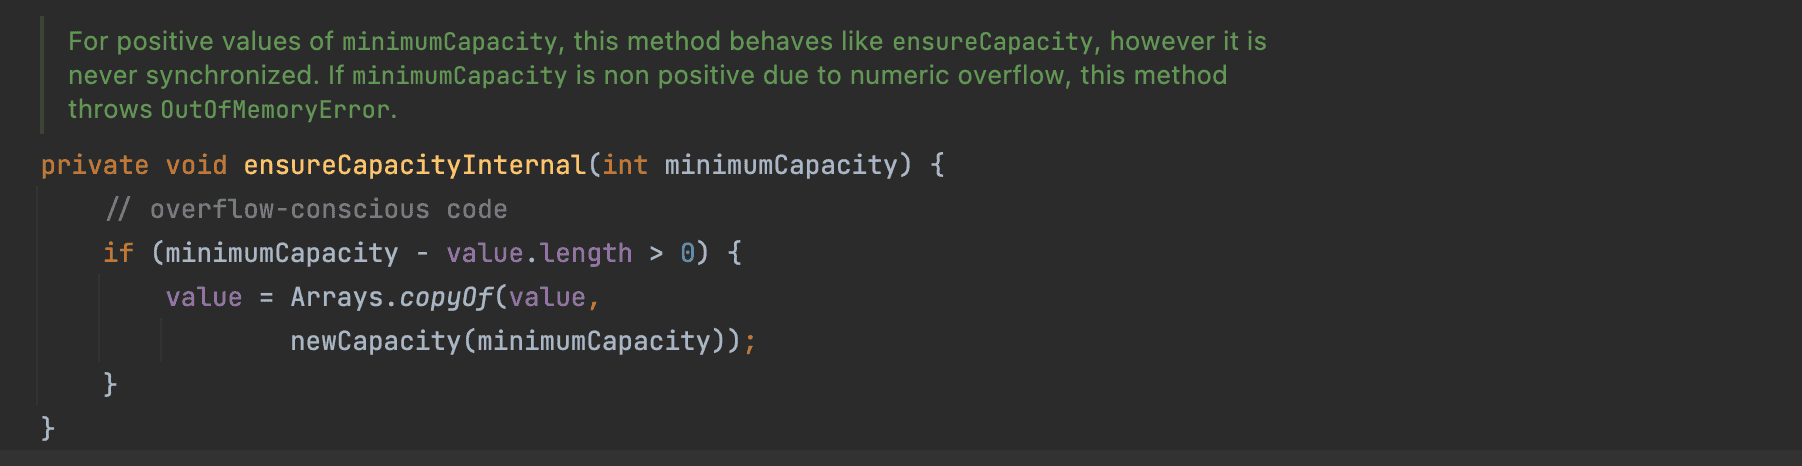
Further down we find an ensureCapacityInternal() method that actually does the Arrays.copyOf() as seen in the flame graph burning some CPU.
To avoid all this array copy overhead can we use a better, bigger initial capacity? Using curl we count the number of characters in the Prometheus page:
curl -Ss optimus-prime-fe:8080/actuator/prometheus | wc -c

13291
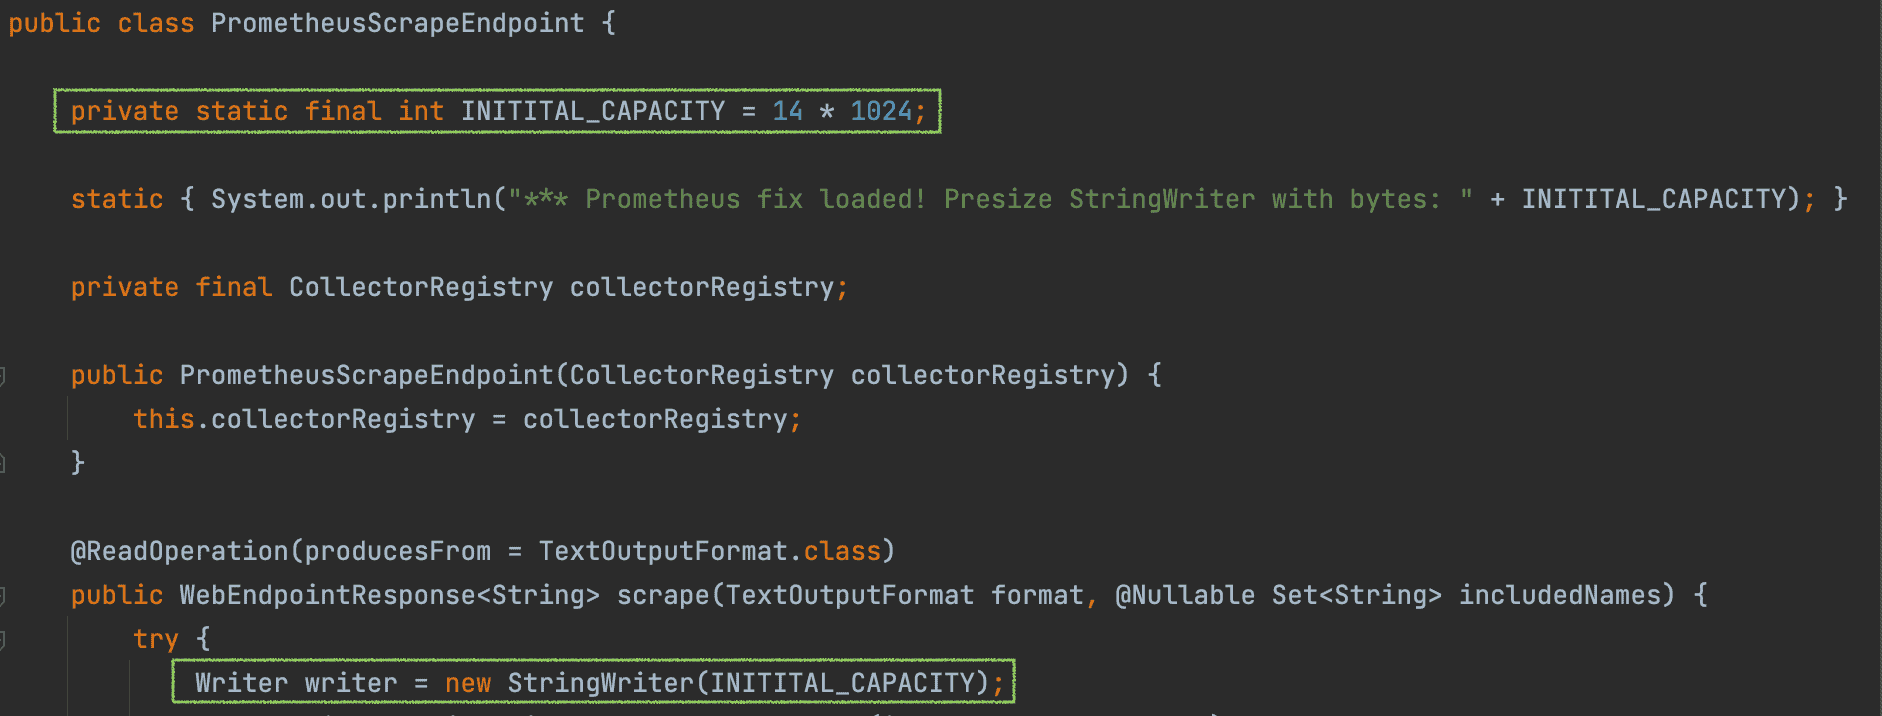
The Afterburner Prometheus page is more than 13.000 characters. We decide to test with 14 * 1024 characters as initial capacity to avoid unnecessary copying of arrays. In the PrometheusScapeEndpoint class we add an INITIAL_CAPACITY constant and use that to initiate a new StringWriter(INITIAL_CAPACITY).
Below the code change in Spring Boot. Notice the static block with println() that gets called when the PrometheusScapeEndpoint class is loaded. We use this to check if we are actually running with the fix.
With this Spring Boot code fix we check the presence of the message in the log and run a new test.
*** Prometheus fix loaded! Presize StringWriter with bytes: 14336
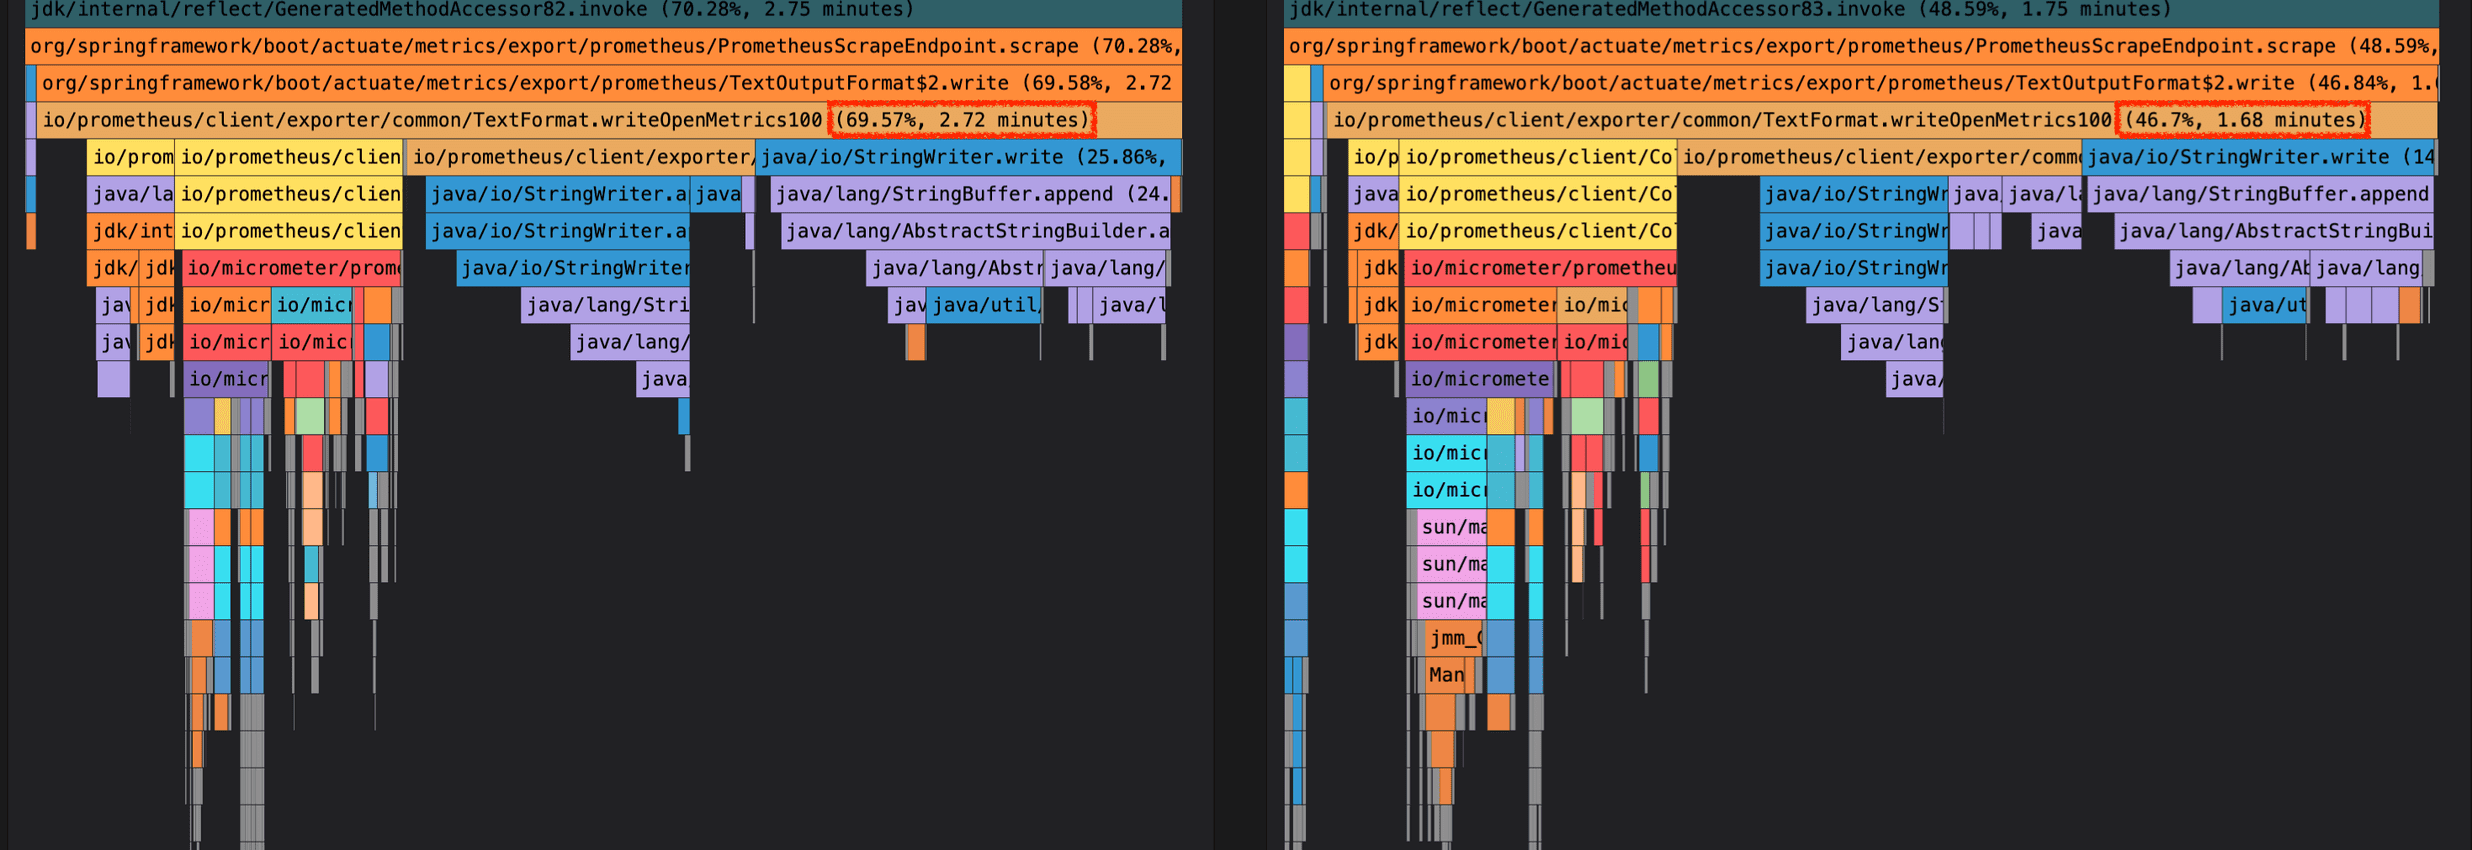
We compare the CPU time spent in Prometheus page creation. The un-fixed run takes 69.5% on the left with the fixed run takes 46.7% on the right. That is a significant change in the good direction! But the overhead is still much higher that we expect.
Unexpected hotspot
After the load test we check again the size of the prometheus page, just to be sure of the size:
curl -Ss optimus-prime-fe:8080/actuator/prometheus | wc -c

865551
What? This is not expected. The Prometheus scrape page is now 865 thousand characters? We counted around 13 thousand before… what happened? Looking at the Prometheus page details we see:
httpcomponents_httpclient_request_seconds_max{...,uri="/db/employee/find-by-name?firstName=Liam",} 0.0

httpcomponents_httpclient_request_seconds_max{...,uri="/db/employee/find-by-name?firstName=Olivia",} 0.0

httpcomponents_httpclient_request_seconds_max{...,uri="/db/employee/find-by-name?firstName=Noah",} 0.0

... many lines ...

httpcomponents_httpclient_request_seconds_count{...,uri="/db/employee/find-by-name?firstName=Emma",} 2.0

httpcomponents_httpclient_request_seconds_sum{...,uri="/db/employee/find-by-name?firstName=Emma",} 0.610186837

httpcomponents_httpclient_request_seconds_count{...,uri="/db/employee/find-by-name?firstName=Ava",} 2.0
This is a list of max seconds spend in an http request. Part of the lines have been replaced by dots. This list goes on and on for each unique uri! For instance, the first line is for uri="/db/employee/find-by-name?firstName=Liam", the second for uri="/db/employee/find-by-name?firstName=Olivia".
This was not our intention. We did not want the firstName parameters to be included because that makes almost each request unique. To fix this issue we change how we use the MicrometerHttpClientInterceptor from the Micrometer library. The full URI of the request is added to the interceptor:
MicrometerHttpClientInterceptor interceptor = new MicrometerHttpClientInterceptor(Metrics.globalRegistry,

    request -> request.getRequestLine().getUri(),

Tags.empty(),

true);
Clearly we should not use the full URI here. We replace it with a method that gets the URI without the parameters (such as ?firstName=Liam):
MicrometerHttpClientInterceptor interceptor = new MicrometerHttpClientInterceptor(Metrics.globalRegistry,

    this::extractUriWithoutParamsAsString,

Tags.empty(),

true);
See full code in Afterburner here. With this second fix we see no more copy arrays in the flame graph of PrometheusScapeEndpoint… The Prometheus page size is now stable in size and does not grow beyond the given new initial size. Good!
Spring Boot fix
To save some wasted cycles and memory in the many deployments of Spring Boot with the Prometheus scraper enabled, we aelso created a pull request at Spring. The fix is a little different than the code shown above. In the final fix the size of the current scrape is saved and used in the next scrape as the initial size plus some bytes to avoid dynamic growth during the building of the page.
The pull request pr-30085 is available in Spring Boot releases 2.5.11, 2.6.5 and 2.7.0-M3!
Have a look at the PR for more details on memory savings as measured with Java Microbenchmark Harness (JMH).
Final Thoughts
A golden rule in performance testing is to change one thing at a time and check again. When you make code improvements or change performance related settings, Perfana makes sure it actually is a performance improvement. Perfana tracks performance changes and shows the impact via the automated requirements check and compare of metrics. When Perfana detects that the performance degrades, it helps you find the root cause.
Details of the test run, such as the CPU flame graphs, point to overhead in your own application as well as (open source) frameworks. The unexpected growth of the Prometheus scrape page caused most of the CPU overhead. We solved that with a fix in our code. But we also found unnecessary allocation of memory in Spring Boot, causing little CPU overhead. But as Spring Boot is running on many servers on the planet, we created a PR that may have some positive impact overall.
Finding performance regression with Perfana automatically helps to confidently release new software.