Performance testing in an agile world
With the adoption of agile development with its shorter time to market and the implementation of micro service architectures in many organisations, the number of required performance tests to release with confidence increases dramatically. The “traditional way” of performance testing, with dedicated performance test specialists, is no longer scalable. Instead, agile development teams should be responsible for the performance of their product and be able to do their own performance testing.
In reality this is easier said than done. Performance engineers are required to be T-shaped generalists: they need to master load test tools, know how to use application monitoring tools, do root cause analysis of issues, tune application servers and or databases and, last but not least, should be familiar with a wide range of software stacks. It usually takes years of experience for performance engineers to gain all this knowledge. This makes performance engineers a rare breed.
Similar to performance engineers, agile development teams have to learn about performance engineering by getting their hands dirty and trying things themselves. To reduce the steepness of the learning curve they need an experienced performance engineer supporting them.
Introducing Perfana
Perfana is an automated performance test solution that aims to do just that: it allows experienced performance engineers to support a large number of agile development teams in their performance engineering and testing efforts. Perfana does this by automating the most time consuming tasks like test result analysis, gathering relevant monitoring data and performance test reporting. Perfana also focuses on transferring knowledge to the teams to make them act more autonomously over time, thus reducing the need for support.
Perfana leverages and integrates with de-facto industry-standard tooling like:
- Load test tools: Gatling, JMeter, LoadRunner
- Metric stores: Prometheus, InfluxDB, Elasticsearch
- Data visualization: Grafana, Kibana
- Alerting: Alertmanager, Kapacitor and Grafana
- Team cooperation: Slack, Microsoft Teams and Google Chats
- Issue tracking: Jira
- Tracing: Dynatrace and Jaeger
This blog demonstrates how Perfana makes life easier for both agile development teams making their first steps in performance engineering as well as the experienced performance engineers supporting them.
In part I of this blog I will show how to set up monitoring for your test, create automated checks, do root cause analysis on performance issues and report the results to stakeholders.
In part II of this blog I will describe how to set up a performance test pipeline using Perfana that can evaluate performance Service Level Objectives in a completely automated way and adds performance to the CI/CD feedback loop.
Perfana demo environment
I have created a docker-compose based environment that allows you to try out all the steps in this blog yourself in your local machine.
Prerequisites
- Docker
- Docker compose
- At least 8Gb (more if possible) of RAM allocated to docker daemon
- Internet connection
Getting started
Clone perfana-demo repository:
git clone https://github.com/perfana/perfana-demo.git
Inside the repository root run the command below, please note that this will download multiple large images and will take a while.
./start.sh -s 15
-s 15 adds a delay of 15 seconds in between the start of containers, to allow some time for initial creation of databases. To reduce start up time of the environment after the initial start up, use -s 0
To stop all containers, run
./stop.sh
User story
To demonstrate the use of Perfana I have created a typical performance engineering user story.
System under test
The system under test called OptimusPrime, consists of two Spring Boot applications and a MariaDB database:
optimus-prime-fe and optimus-prime-be are two instances of Afterburner, a Spring Boot application built for testing performance related issues.
In the scope of this blog we will test two optimus-prime-fe endpoints:
- remote_call_async:
optimus-prime-fedoes 3 asynchronous calls in parallel tooptimus-prime-bethat returns a response after a fixed delay of 100 ms (see documentation for remote-call-async and delay) - flaky_call: call to
optimus-prime-fethat returns response after a random delay and for 5% of the calls a http 500 error (see documentation for flaky call): - database_call:
optimus-prime-fedoes 1 asynchronous call tooptimus-prime-bethat will query the employees database with this query (see documentation for remote-database):
SELECT * FROM employees.employees WHERE first_name = <first_name>
Service Level Objectives
The OptimusPrime stakeholders have come up with the following performance Service Level Objectives, a.k.a performance requirements:
- The application should be able to handle a peak load of 30 requests per second (RPS)
- Under load of 30 RPS the 99th percentile response times should be less than 1 second
- Under load of 30 RPS the MariaDB database should use less than 50% of the available CPU
Load test script
To prove the system under test meets the stakeholder requirements we will use a Gatling load test script. The script can be found in the perfana-gatling-afterburner repository
The Gatling script is triggered by the events-gatling-maven-plugin and is configured by selecting profiles through parameters set in the Jenkins job. We will use the test-type-stress profile in the pom.xml. This will ramp up the load starting with 1 user per second to 30 users per second over a period of 1000 seconds.
<initialUsersPerSecond>1</initialUsersPerSecond> <targetUsersPerSecond>30</targetUsersPerSecond> <rampupTimeInSeconds>1000</rampupTimeInSeconds> <constantLoadTimeInSeconds>1</constantLoadTimeInSeconds>
Monitoring
To monitor the system under test the Perfana demo environment contains a number of components:
- InfluxDb: Time based series database. Stores load related metrics (e.g. throughput, response times) from Gatling and docker stats pushed by Telegraf
- Telegraf: Monitoring agent, collects docker stats
- Prometheus: Time based series database, stores JVM and application metrics exposed by Spring Actuator
- Alertmanager: Handles alerts coming from Prometheus
- Jaeger: UI to examine distributed traces pushed through Spring Cloud Sleuth
- Grafana: Visualizes metric data from InfluxDb and Prometheus
Perfana aggregates and evaluates relevant data for your test run from all these sources. It also allows users to quickly drill down to relevant monitoring data in Grafana and traces in Jaeger.
Start a test run
The Perfana demo environment comes with a Jenkins container preconfigured with a job that triggers the Gatling script to execute a load test on our system under test.
Go to Jenkins:
http://localhost:8080
and login with username perfana and password perfana
Open job OptimusPrime an click Build with parameters
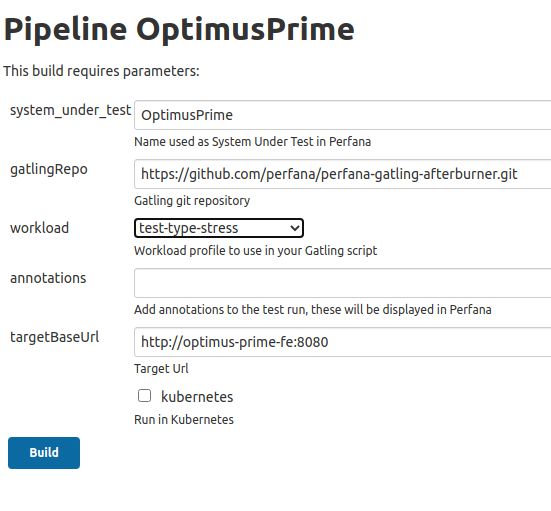
Select workload test-type-stress and click Build
Click on the progress bar to view the logs in the Console Output:
[INFO] [MyPerfanaEvent] [PerfanaEvent] add Perfana event: Test run started
...
Script settings:
useProxy: false
graphitePrefix: gatling2.OptimusPrime.acc
debug: false
targetBaseUrl: http://optimus-prime-fe:8080
testRunId: OptimusPrime-2
initialUsersPerSecond: 1.0
targetUsersPerSecond: 30.0
rampupTimeInSeconds: (1000,SECONDS)
constantLoadTimeInSeconds: (1,SECONDS)
Simulation io.perfana.afterburner.gatling.setup.OptimusPrime started...

====================================================================
2020-11-10 19:18:47                                       5s elapsed
---- Requests ------------------------------------------------------
> Global                                         (OK=9      KO=0)
> remote_call_async                              (OK=5      KO=0)
> database_call                                  (OK=4      KO=0)

---- Acceptance test -----------------------------------------------
[-                                                             ]  0%
          waiting: 15525  / active: 1      / done: 4
====================================================================
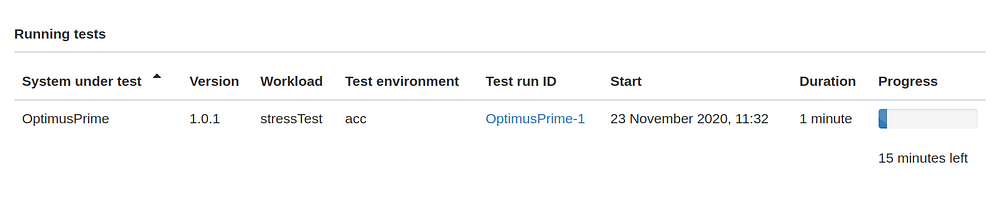
As soon as Perfana receives the Test run started event from the events-gatling-maven-plugin the test run will be visible in Perfana. To open Perfana go to
http://localhost:4000
and login with username admin@perfana.io and password perfana
In the home page click on system under test OptimusPrime, this opens the test runs view, where you see the test in the Running test section
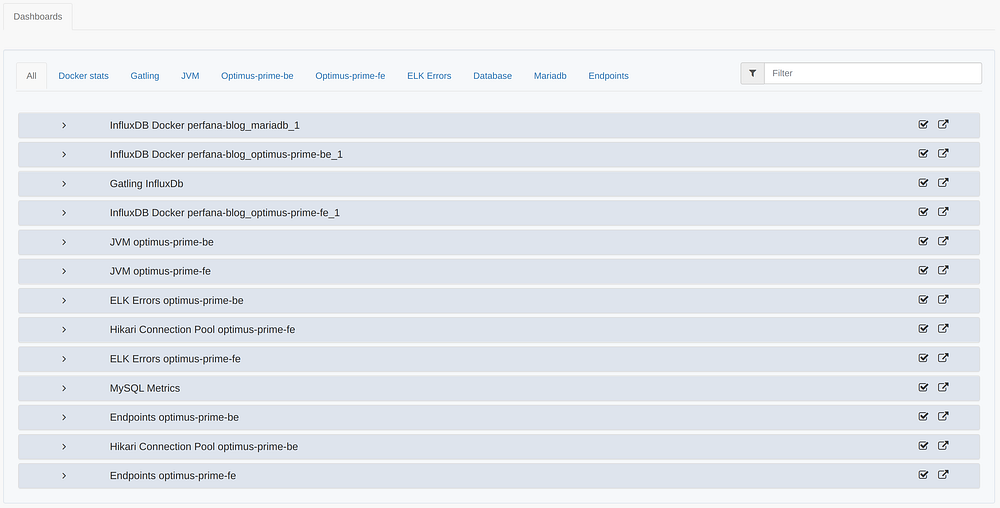
Click on the test run to see the Grafana dashboards that have been linked to the test by the automated configuration based on metric data discovery, as described below. You can expand or collapse the rows to view the Grafana dashboards
Automated configuration of Grafana dashboards
One of the key features of Perfana is the automated configuration of relevant Grafana dashboards for your test. This feature saves performance engineers and the agile teams they are supporting a lot of time and at the same time promotes a consistent way of analyzing and reporting of performance test results.
To explain this feature we first have to explain how Perfana leverages Grafana dashboards for performance testing purposes.
Grafana is the de-facto standard open source solution for visualizing time-based series. It supports a whole range of datasources. This makes it a perfect fit for the performance test use case where you want to monitor several components in the stack of your system under test, e.g. hardware resource metrics, application resource metrics (such as JVM metrics), database metrics, etc.
Perfana uses Grafana’s HTTP API to link Grafana dashboards to performance tests, allowing users to deep link effortlessly into relevant Grafana dashboards and metrics data for a performance test run.
To use a Grafana dashboards in Perfana is straight forward: the first step is to register a Grafana instance in Perfana. This done via environment variables in the docker-compose.yml file. Next step is to add a Perfana tag to a Grafana dashboard you would like to use in your performance test analysis. The dashboard will then be picked up by the sync job that runs every 30 seconds and will show up in Perfana
http://localhost:4000/grafana-configuration
Now the Grafana dashboard is available in Perfana, you can add it to your system under test. To find out how follow these instructions.
Please note that in our demo environment a number of dashboards have already been added by the automated configuration feature. This feature automatically adds template dashboards to tests with a specified profile, based on a metrics discovery mechanism that uses the Grafana templating feature.
To see the automated configuration set up, click on PROFILES in the ADMIN section of the side bar.
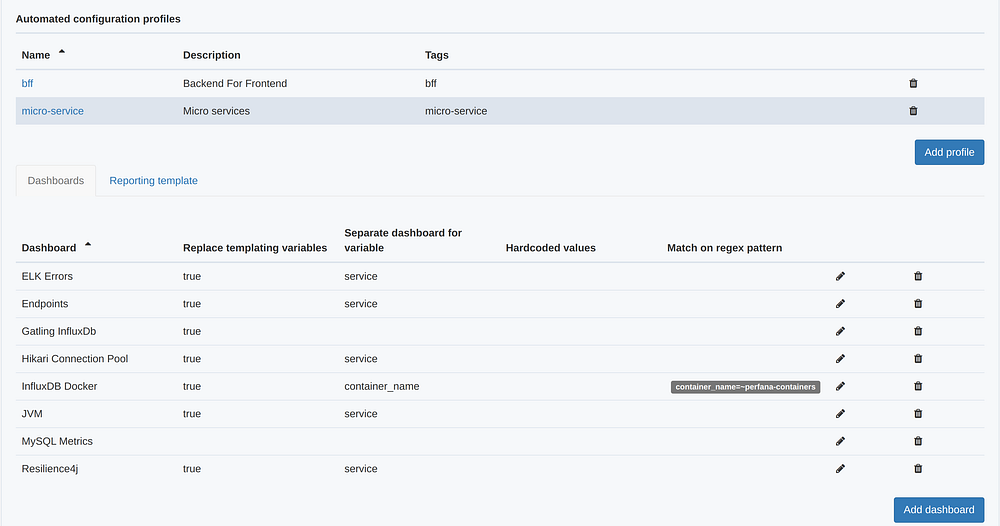
You can configure Grafana template dashboards for each profile. This can be done by adding a perfana-template tag to a dashboard in Grafana. Read more here on the available configuration options.
We started our stress test using the test-type-stress workload (maven-) profile. In this profile we also add the micro-service tag:
<tags>micro-service</tags>
The automated configuration feature will automatically add the configured dashboards for the micro-service profile to the test.
Analyzing your test results
By now the test run we started earlier probably has finished. Look for the test run in the the Recent runs section:
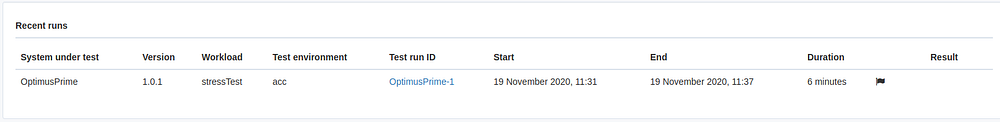
Click on the test run to start analyzing, this will open the Test run summary view.
The view has a number of sections:
- Test run information: contains meta data for the test. You can add some annotations or edit the system under test version if required.
- Check results: shows the results of the automated checks. We will add some later.
- Variables: shows (dynamic) values passed via the eventVariables in the script.
- Alerts: shows alerts triggered during the test run.
- Events: shows test run events that happened during the test run.
- Links: contains dynamic links to external systems, in this case to the Kibana UI.
Automated checks
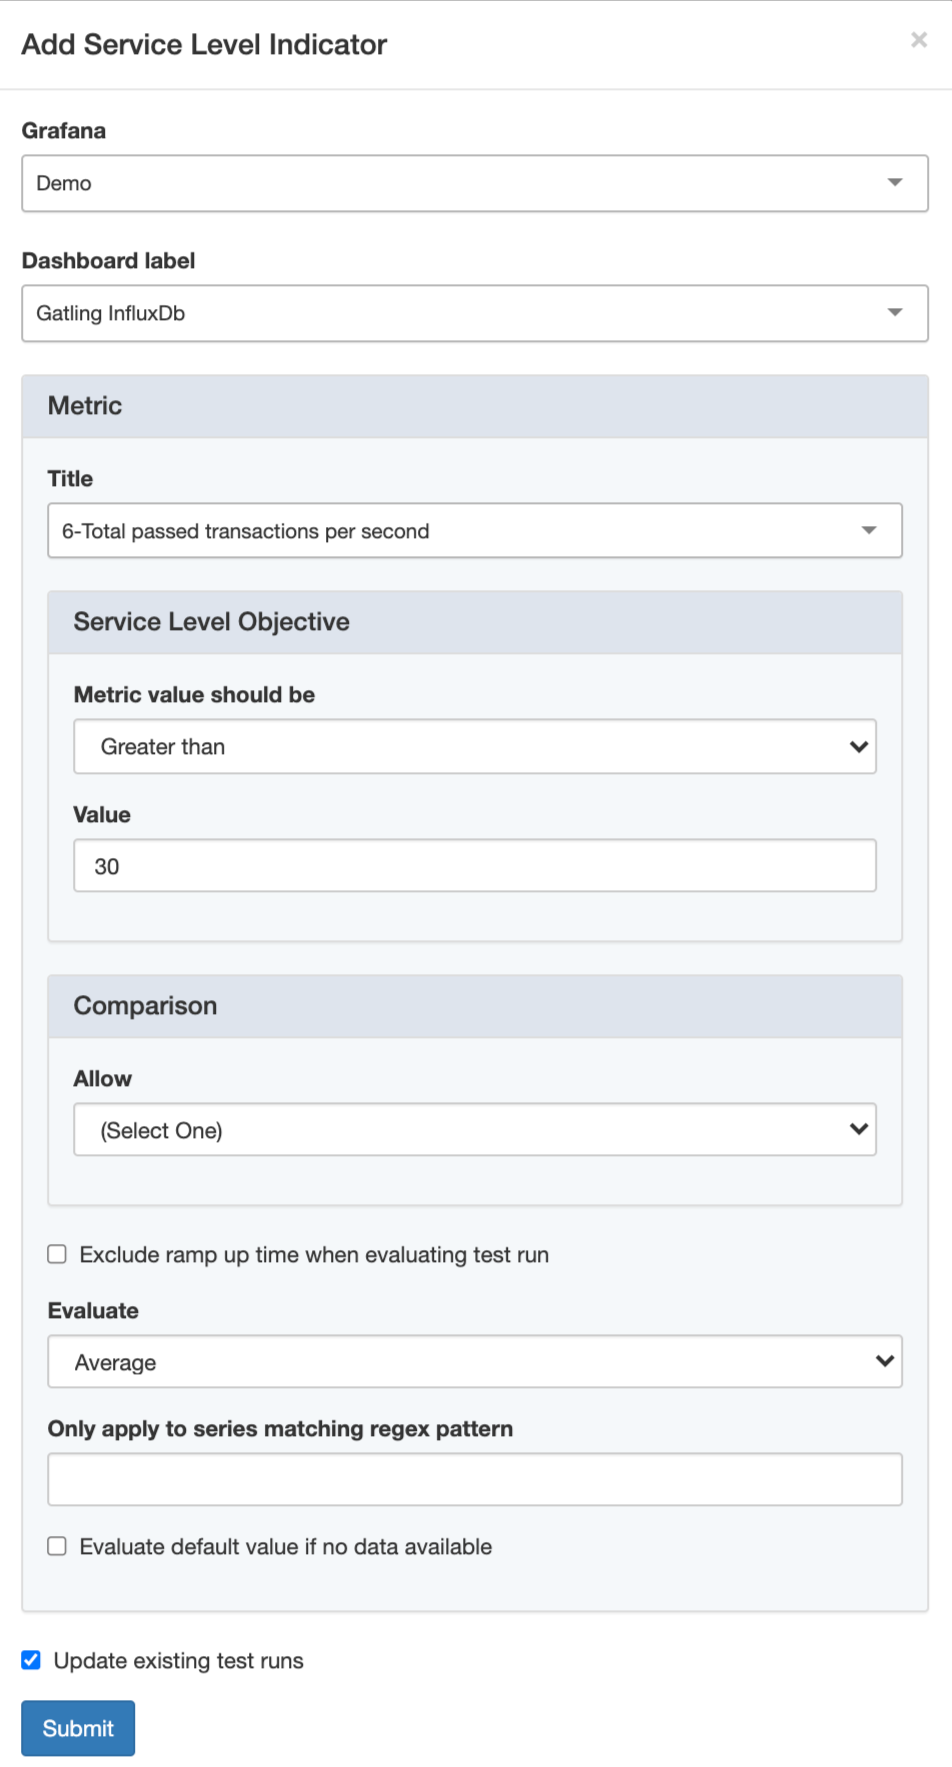
Automated checks can verify if our system under test meets the Service Level Objectives (SLO) set by the stakeholders. You can create an automated check for each SLO by clicking on SERVICE LEVEL INDICATORS in the SETTINGS section in the sidebar and clicking Add metric
The Add Service Level Indicator dialog shows up with these fields:
- Dashboard label: Select dashboard to select metric from
- Panel: Select panel. Currently panels of types
timeseries,tableandstatcan be used as Service Level Indicator. - Service Level Objective: configure the SLO to check
- Comparison: the allowed deviation between test runs
- Exclude ramp up time when evaluating test run: Check this option to exclude the configured
rampUpTimeperiod from evaluation.
In case of our test, a stress test, the whole test consists of ramping up, so make sure this option is unchecked. In a non-stress test you probably want to exclude the ramp up period from the evaluation.
- Average all panel series when comparing test runs: check this option to average checked all series produced by the panel before evaluating the data.
- Evaluate: select the aggregation used when evaluating:
Average(default),Maximum,MinimumorLast. - Only apply to metrics matching regex pattern: a panel can produce multiple series. Provide an optional regular expression, e.g.
.*cpu.*, to filter the series that the configured checks apply to. - Update existing test runs: if checked, the checks will be evaluated for all existing test runs with matching
System under test,Test environmentandWorkloadproperties.
Make sure to check this option so the check will be applied to our existing test run!
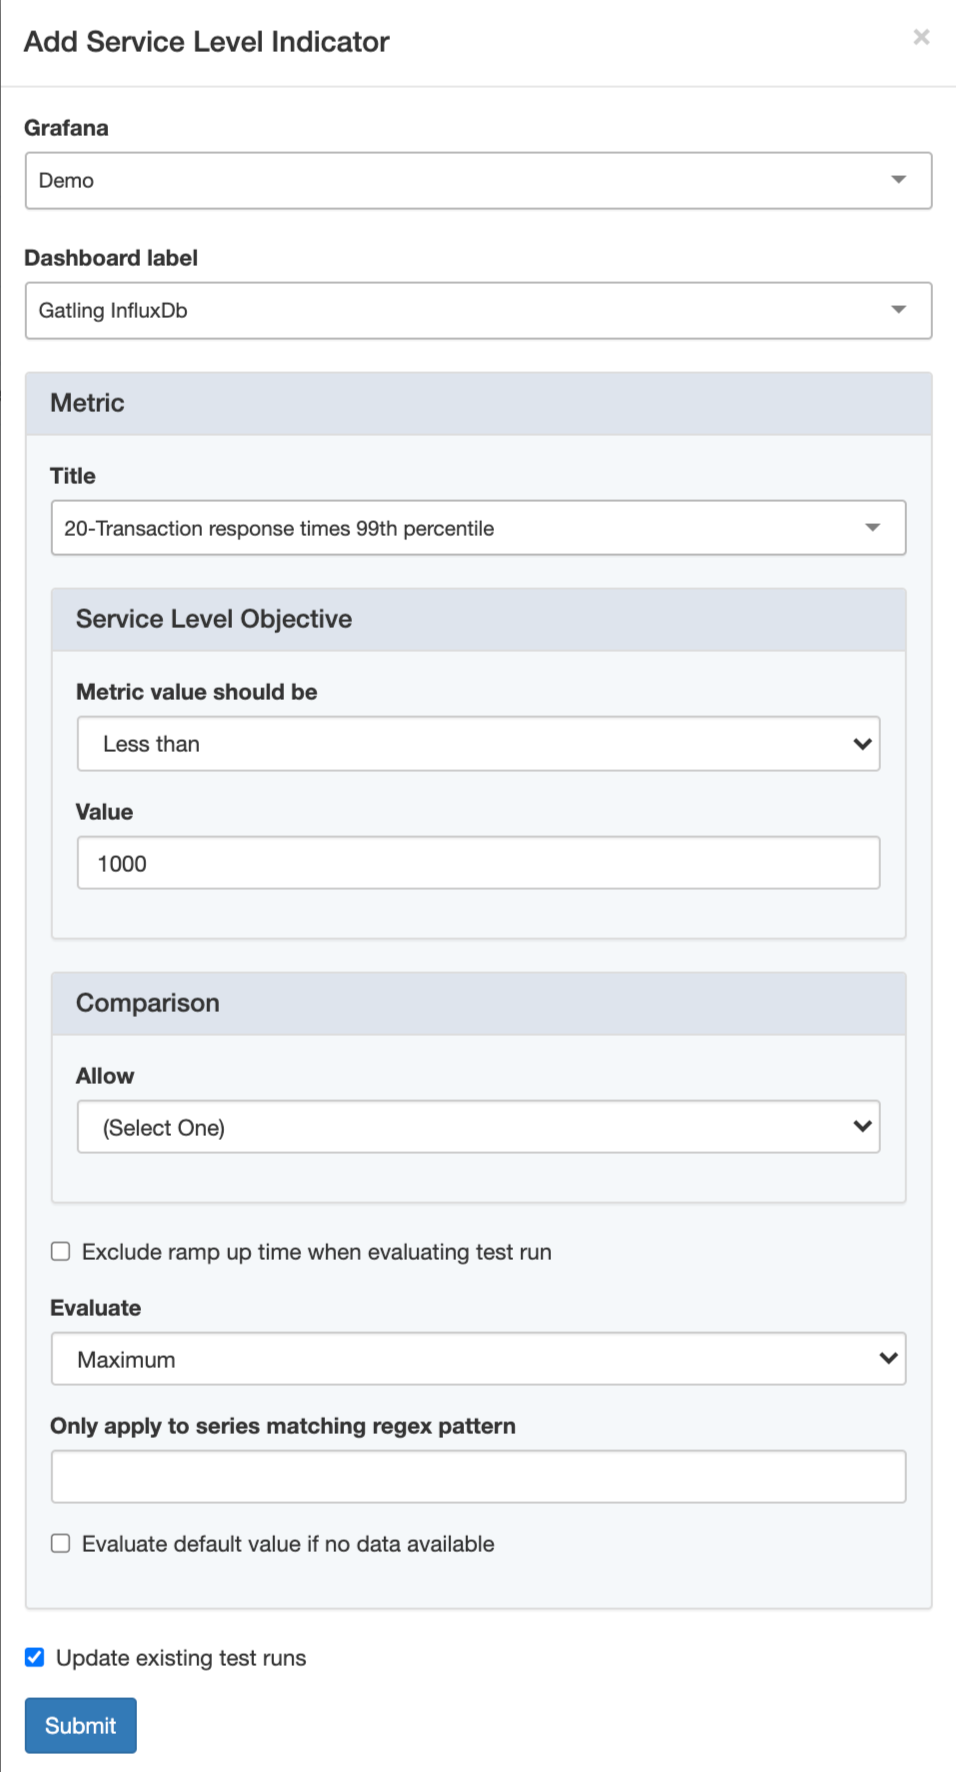
Now create these three Service Level Indicators:

After creating the automated checks, click Back to return to the test run summary. As you can see, checks on all the SLO’s have failed. We have some work to do! Let’s try to determine the root cause of the performance issues.
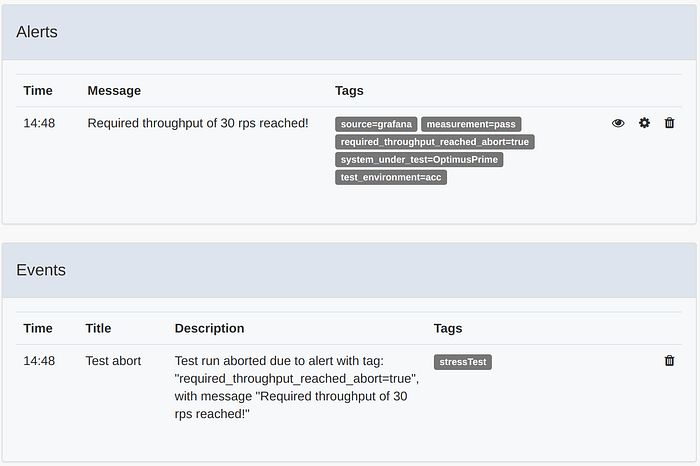
Alerts
Test run alerts can be very useful in helping you find bottlenecks in your performance tests. When you are monitoring multiple components, each with multiple dashboards and multiple metrics, alerts can point you in the right direction when doing a root cause analysis of a detected performance bottleneck.
For our test run the Alertssection looks like this (this might look different on your local machine, depending on the available resources):
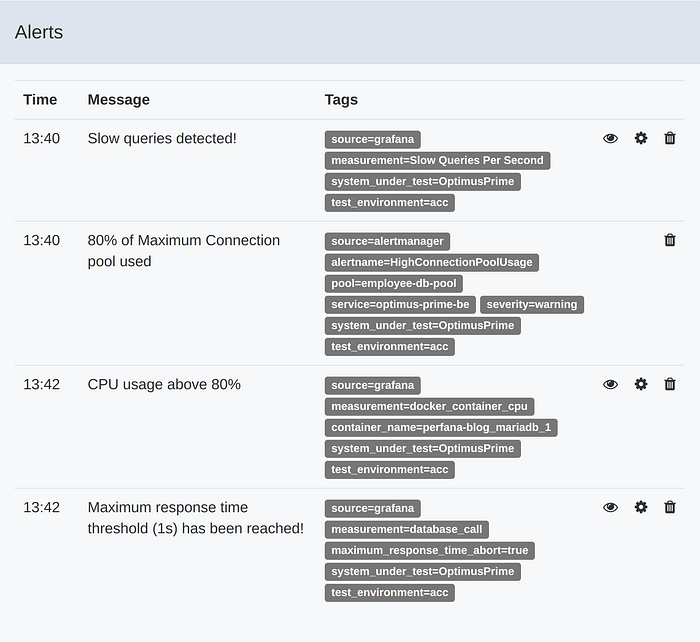
To explain what happened in this test run we have to look into Perfana’s alerting feature first.
Perfana can be configured as receiver webhook for the following alert sources:
- Alertmanager, for alerts on Prometheus metric data
- Kapacitor, for alerts on Influxdb metric data
- Grafana, for alerts coming from the Grafana alerting system
When Perfana receives an alert from any of these sources, it will map it on a running test based on the alert tags and plot it as a vertical line all graphs linked to the test.
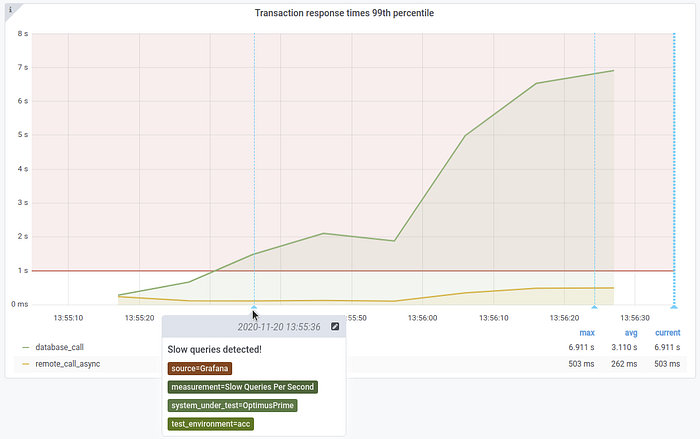
Read more here on setting up alerting in Perfana.
Abort test run based on alert
Did you ever run a stress test and forgot to keep an eye on it while it reached the stage where the system under test collapsed under the load? Most likely you ended up with performance test results with tens of thousands of failed requests, flooded logs and messed up, unreadable graphs.
Perfana can automatically abort test runs based on alerts that are triggered during the test. This allows teams to run stress tests, or other destructive tests, fully automated and unattended.
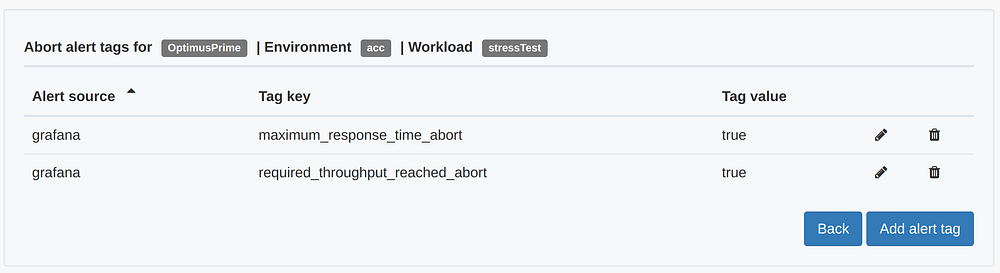
In our test two alerts have been configured in the Gatling dashboard and tagged to abort the test.
- An alert that triggers if response times exceed 1 second
- An alert that triggers if the throughput exceeds 30 rps
Please note the required_throughput_reached_aborttag was added to end the test. In Perfana, the alert tag is then configured to abort the test in case the alert is triggered. These tags can be found in the ABORT ALERT TAGS that are found in the SETTINGS section of the sidebar.
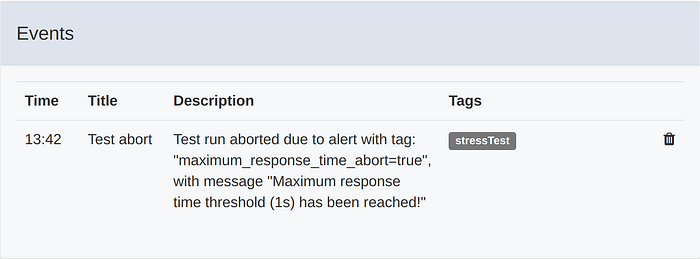
When one of these alerts is triggered it will result in a Test abort event, ending the test.
Root cause analysis
The alerts that were triggered during the test run points us in the direction of the database.
To deep dive under the hood of the system under test we enabled distributed tracing in the Spring Boot applications using Spring Cloud Sleuth.
In the application properties for optimus-prime-fe and optimus-prime-be two headers are specified as “baggage”, perfana-test-run-id and perfana-request-name
This allows us to drill down using the Jaeger UI into the distributed traces collected for the test run. In order to do so, from the Test run summary view click on the Jaeger tab.
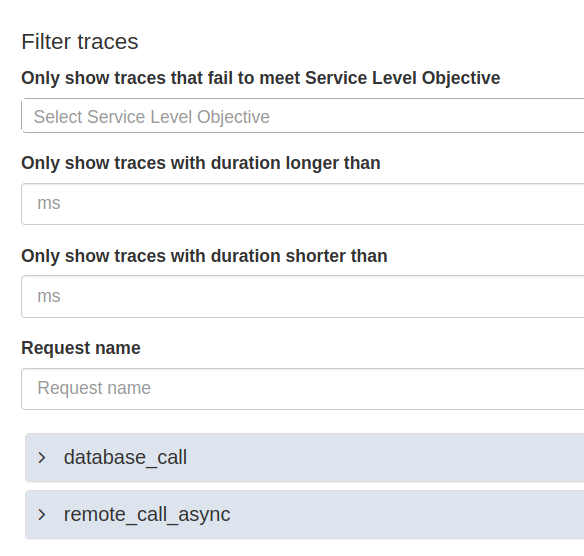
The view offers a number of ways to filter the traces, and then deep links into the Jaeger UI to show the traces for the the selected request. Since we suspect the database_call has performance issues, let’s drill down on one of the traces for this request.
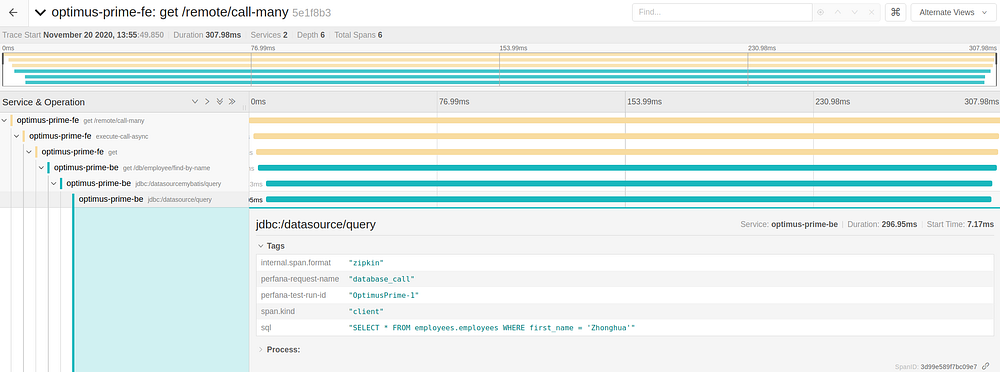
We see that most of the latency of the calls is in the query to the database, something we already expected based on the alerts we received.
To investigate the database in more detail we will connect to it via OmniDb, located in
http://localhost:8888
Login using user admin and password admin
Select the employees database, paste the query from the Jaeger trace in the query editor an run the query. When prompted for the database password, provide perfana.
SELECT * FROM employees.employees WHERE first_name = 'Zhonghua';
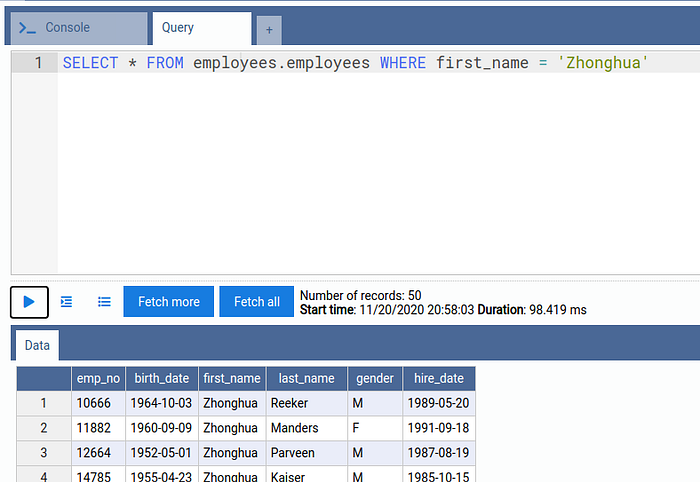
The output shows the query takes almost 100 ms to execute. Now let us run an explain plan for the query:
explain SELECT * FROM employees.employees WHERE first_name = 'Zhonghua';
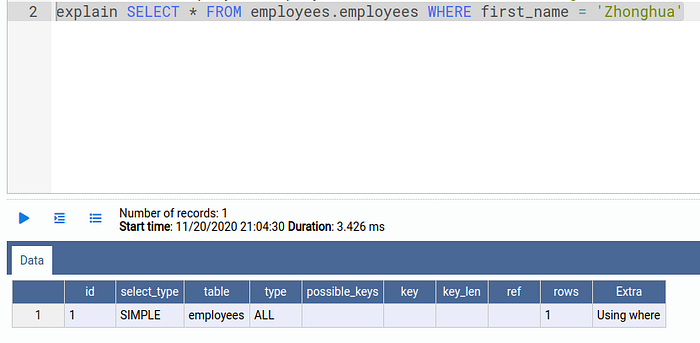
As we can read in the MariaDB documentation type ALL means the query is using a FULL TABLE SCAN. This happens when the optimizer could not find any usable index to access rows.
To find out what indexes are available, execute
SHOW INDEXES FROM employees.employees;
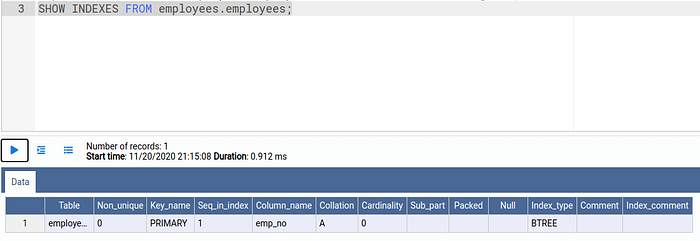
The output shows there is one index available on the column emp_no.
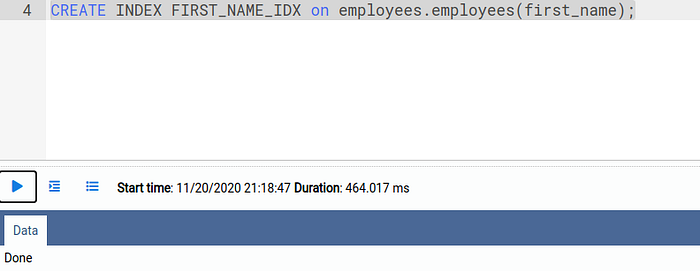
We will add an additional index on the column first_name by executing this command:
CREATE INDEX FIRST_NAME_IDX on employees.employees(first_name);
Finally, analyze the table to optimize the query execution plan:
ANALYZE TABLE employees.employees;
Retest
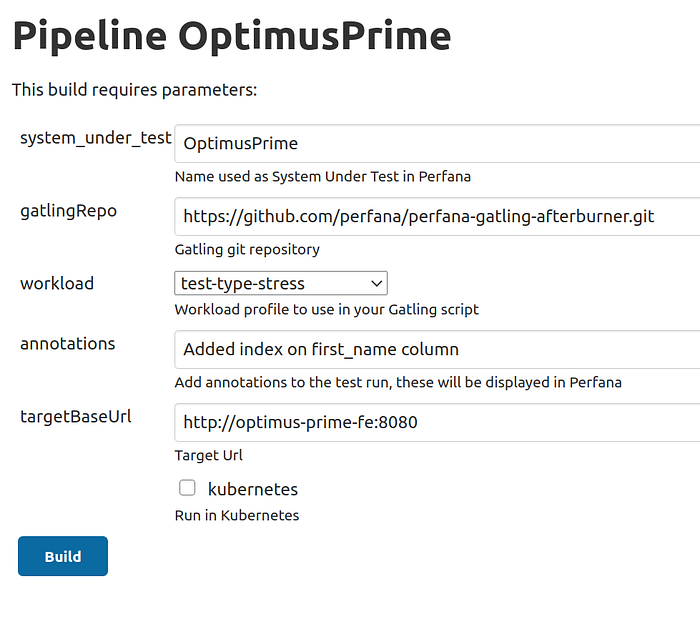
In Jenkins, go to the OptimusPrime again, click Build with Parameters and use the same parameters. But this time add some annotations to clarify what has changed in this test run.
Added index on first_name column
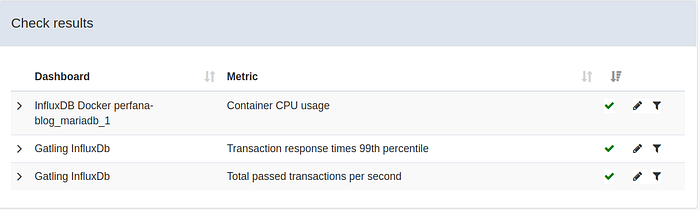
Adding the index seems to have fixed our performance issue! After the test run all automated SLO checks pass:
This time the test was stopped when the required throughput of 30 rps was reached:
Reporting
Now that we have resolved the database bottleneck, we can report our results to our stakeholders. The first thing we will do is tag the test run. Since we have now proven that the application ready for production we will add the tag release-1.0 by clicking the tags in the the Test run information section.
In Perfana you can set up a reporting template that can be used to automatically generate reports for each test run. To create a reporting template click on REPORTING TEMPLATE in the SETTINGS section of the sidebar.
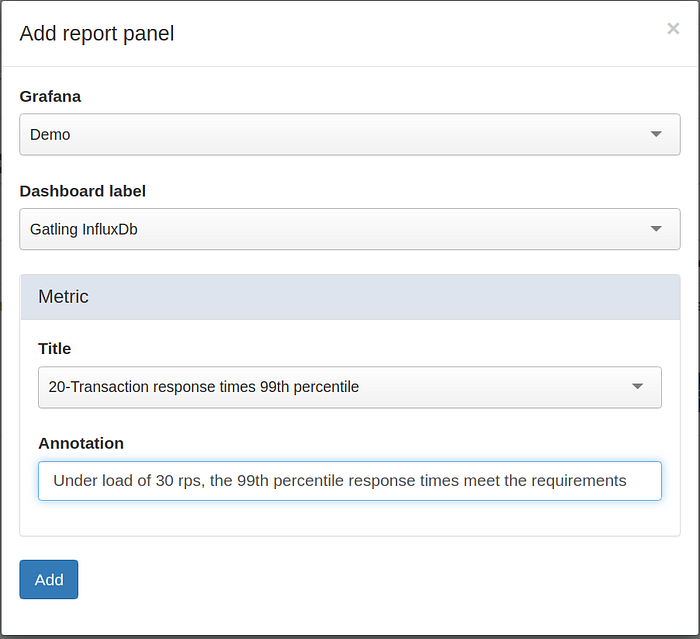
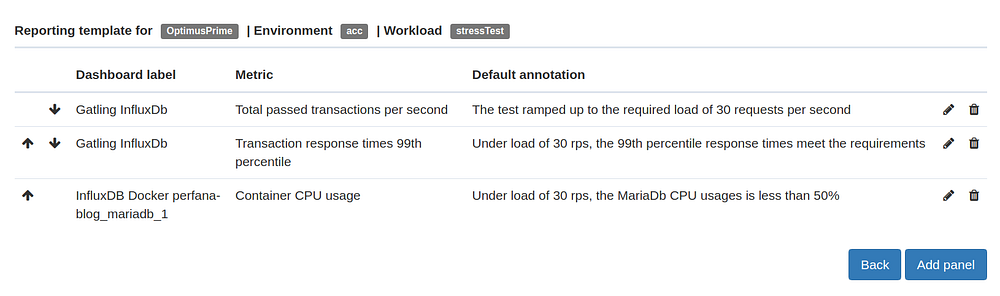
We will create a report containing graphs for the three Service Level Indicators we specified earlier. To do so, click Add panel and select the relevant dashboard and metric. We will also add a default annotation that will be used in the report.
Do the same for the rest of the SLI’s. You can use the arrows to change the order of the items.
Now go back to the test run details view where you can find the report under the Report tab.
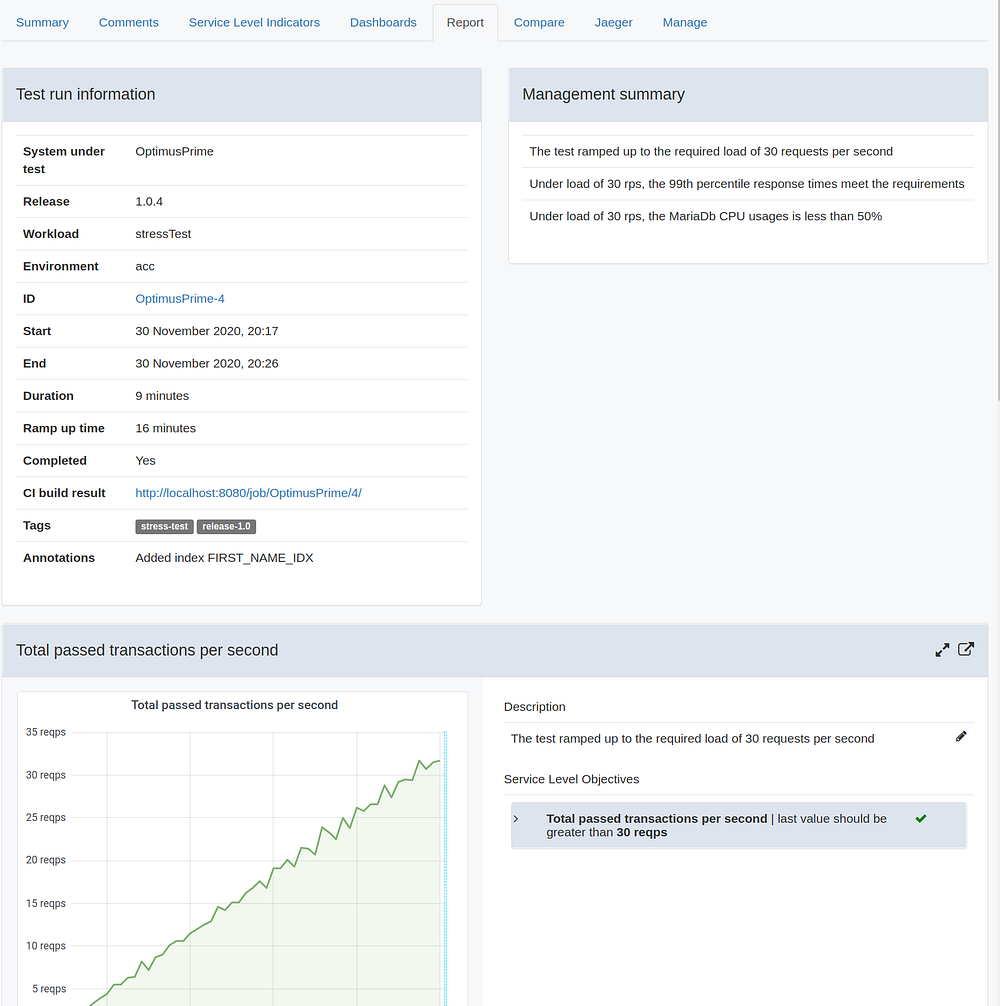
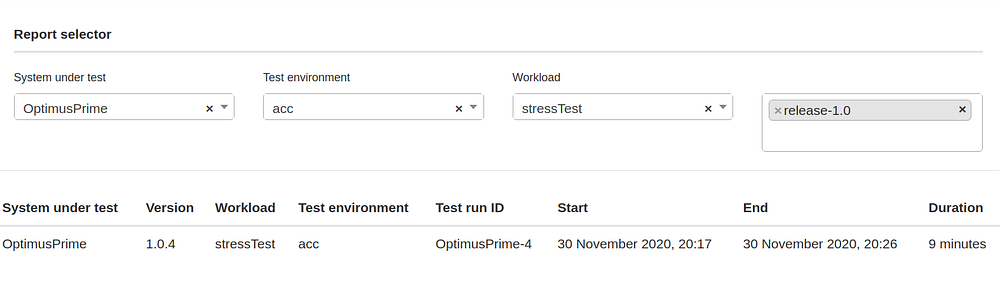
The report can also be found via the REPORTS in the top section of the sidebar. You can use the Report selector to filter one or more reports, for instance all reports for test runs that have been tagged for a specific release.
Takeaways
In this blog I have shown you how Perfana can help flatten the learning curve for agile development teams making their first steps in performance testing.
In the next part of this blog I will describe how to set up a Perfana as a quality gate in a CI/CD pipeline. I will also demonstrate how Perfana integrates with cooperation tools like Slack, Microsoft teams and Jira to share performance test knowledge within and across teams!